POSTS
Getting Started with Shaders
Shaders are essentially programs which can be compiled and run within your graphics card (or CPU if you are using software rendering) to control how pixels are rendered to your screen, and are the foundation for modern graphics programming.
An amazing resource I have been looking at for learning how shaders work is the Book of Shaders, which teaches you how to write shaders from scratch, from drawing lines and shapes to more interesting forms of art such as Voronoi diagrams. The focus is mainly on fragment shaders, so your time with the book will be mostly spent shading within a 2-dimensional square. But, it’s a square with unlimited potential, as shown by any of the demos on Shadertoy.
The online version of the book also comes with an equally-amazing shader editor which provides an interactive way to experiment with the shader examples right within the browser. Not only do you get feedback instantly while typing, but data types like numbers and vectors can have their values changed via a smart widget that pops out when you select a value in the editor, which changes its UI according to the value type. For instance, when selecting a 3-dimensional vector value, the editor assumes that the vector is representing a colour and so it pops out a handy colour picker tool.
The most interesting constraint when writing fragment shaders is that your shader is called once for each pixel. This means no shared state, so in a regular imperative program you might draw a line in this manner:
// draw a line from (2, 2) to (2, 5)
for (var i=0; i<=3; i++) {
  var x = 2;
  var y = 2 + i;
  drawAPixelAt(x, y);
}
But a shader program can’t do the same thing, because any variables set by the shader wouldn’t persist to the next invocation. Instead, you would need to provide an equation to express your line, like this:

#ifdef GL_ES
precision mediump float;
#endif

uniform vec2 u_resolution;

// Plot a line on Y using a value between 0.0-1.0
float plot(vec2 st, float pct) {
  return smoothstep( pct-0.02, pct, st.y) -
         smoothstep( pct, pct+0.02, st.y);
}

void main() {
  // adjust coordinates by screen resolution
  vec2 st = gl_FragCoord.xy/u_resolution;

  // draw a straight line at .2
  float y = .2;

  // base colour is black
  vec3 color = vec3(0.);

  // Plot a line
  float pct = plot(st,y);
  color = color+pct;

  gl_FragColor = vec4(color,1.0);
}
My attempt to explain how the above code works:
mainis called once for each pixel on the screengl_FragCoordis a 2-dimension vector provided by GLSL which provides the pixel coordinates- we scale the pixel coordinates into the 0.0 to 1.0 range so they are easier to work with
- the
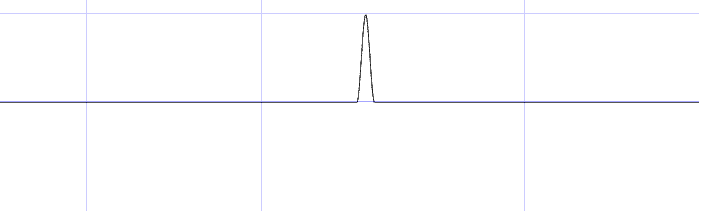
plotfunction really should be played with within the editor to get an intuition about how it works. It performs two separate interpolations using smoothstep, then subtracts them, creating a function that looks like this on a graph:
I’m still at the beginning stage, learning about colours and shapes. So, enjoy this set of 4 coloured squares!
-
shaders
webgl